Website performance metrics from real users with minimal impact.
Website performance metrics from real users with minimal impact.
Things to consider setting website load performance targets
More than a few years now, the spotlight developers and organizations like the W3C are pushing toward the creation, the standardization and the adoption of new API’s. Focused on performance, security, and accessibility, in particular performance. Browsercapabilities have been finetuned and implemented to help gauge and improve the performance of webapplications.
Case studies done by online retailers and universities suggest that for every second of pageloadtime above two seconds the conversion rate decreases between 7% to 10%. The talk “The real world impact of site speed on conversion” by Andy Davies and Simon Hearn dives deeper into the impact of performance on a site. Your website could be within the magical 2 second mark on your machine. Do realize that most real webusers do not use a 800 dollar plus device with a company WIFI or LAN connection. I found in my daily activities that we tend to analyze website performance with Ping tooling like webpagetest, pingdom or yellowlab. These tools and the browser developer tool deliver amazing value for finding problem areas of your site and I advise you to check them out. They do not take into account real user device performance and connection.
The impact and variables that influence website performance vary and can be hard to analyze. In my opinion analyzing website performance from within the browser of the users device is the becoming the only way obtain meaningful data. Fortunately the World Wide Web Consortium recognized this in 2012 and started work on the Navigation Timing Specification.
Navigation Timing API
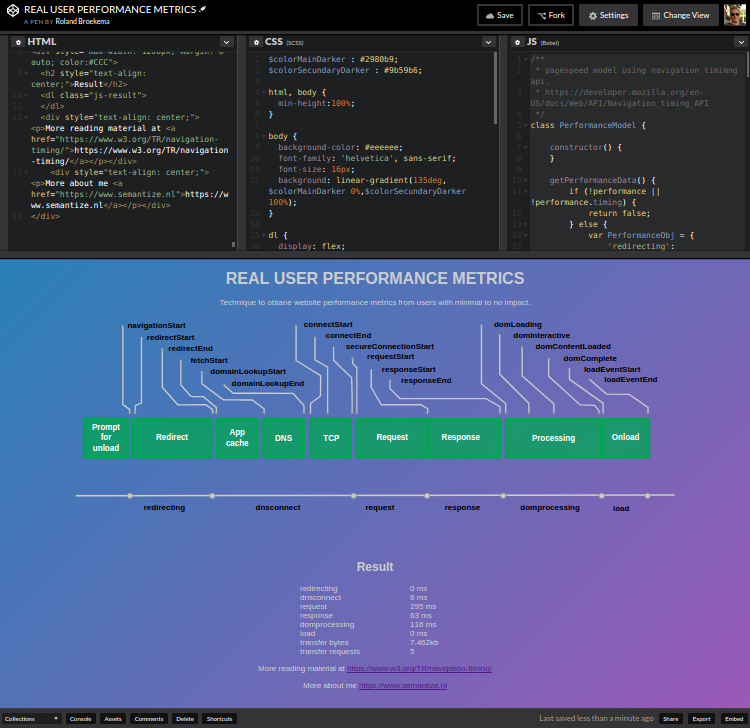
The Navigation Timing API can be used to gather performance data on the client side. It breaks down the events required to retrieve and display web pages in the browser and provides a time stamp for each event. This data can then be sent to a server via XHR. In addition it provides a means to measure data that was very difficult to measure by other means such as time to unload a previous page, domain look up time, onload total time, etc.

A linkt to the W3C documentation about Navigation Timing.
Seeing the value in performance monitoring.
Extracting value from performance measurements requires that your team an product owner get a deeper understanding of website performance and measurement technique. Keeping it simple with understandable code was one of the main objectives on creation of the example.
I decided to go for the following variables to measure.
- Redirecting in milliseconds
- Dnsconnect in milliseconds
- Request in milliseconds
- Response in milliseconds
- Domprocessing in milliseconds
- Load in milliseconds
- Transfer in kilobytes
- Transfer request count
class PerformanceModel {

    getPerformanceData() {
        if (!performance || !performance.timing) {
            return false;
        } else {
            let PerformanceObj = {
                'redirecting': performance.timing.fetchStart - performance.timing.navigationStart,
                'dnsconnect': performance.timing.requestStart - performance.timing.fetchStart,
                'request': performance.timing.responseStart - performance.timing.requestStart,
                'response': performance.timing.responseEnd - performance.timing.responseStart,
                'domprocessing': performance.timing.domComplete - performance.timing.responseEnd,
                'load': performance.timing.loadEventEnd - performance.timing.loadEventStart
            };

            /**
             * Obtaining the transferred kb of resources inluding estimated document size.
             */
             if (window.performance && window.performance.getEntriesByType) {
                let resources = window.performance.getEntriesByType('resource');
                let documentSize = unescape(encodeURIComponent(document.documentElement.innerHTML)).length/4.2;
                let byteTotal = 0;
                for (const resource of resources) {
                    byteTotal = byteTotal + resource.transferSize;
                }
                PerformanceObj.transferbytes = byteTotal + Math.round(documentSize);
                PerformanceObj.transferrequests = resources.length + 1;
             }

            return PerformanceObj;
        }
    }
}
Conclusion
Measuring website performance from within the client browser is the only way to obtain data that reflects device and connection speed of your users. The Navigation Timing API is one of the several browser capabilities you can employ. It can provide your analytics tag a high level of detail while being very easy to use. Finally, the support for this API is very good among desktop and mobile browsers, So start using it today.
